
Exploring Parabolas
By
Cassian Mosha
Construct the graphs of the parabola in the form of ax^2+bx+c with different values of a, b, and c; a, b, and c can be any rational numbers.

Graph 1
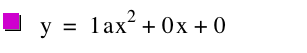
The given graph shows the common graph of a parabola with a y-intercept (0, 1) that is assumed to be the constant number of the equation given a=0, and b=0 too.
Now we will change the values of a, b and c by assuming a=2, b=2 and we keep c=1
![]()

Graph 2
We can see the graph displayed, and it shows the y-incept is the same but the new parabola shifted down and shrinks towards and close to the y-axis. We will like also to know what will happen to the parabola if a=1, b=0, and c=0. Probably this could be the first exploration, but we will see what happen to the parabola here.
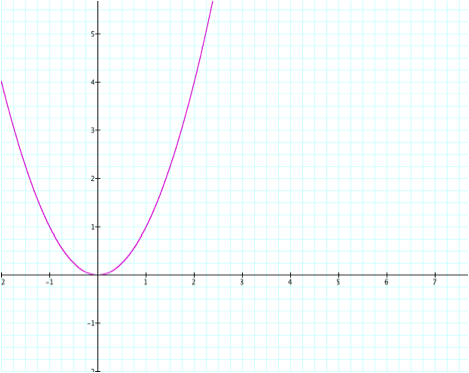
Graph 3
As we can see the parabola still opens upwards, but the y-intercept changed to be at point (0,0), also the x-intercept is at point (0,0). Now we will try to change the values of the constants again and see how the parabola behaves. This time we will make a=2, b=2, and c=2.
![]()

Graph 4
As we can see the parabola still opens upwards, but this time since we changed the constants the parabola shifted up two units, and the intercepts are no longer at the origin but rather at point (0,2) which we can predict as always equal to the constant term, but we will affirm it when we conclude our exploration and know for sure how different parabolas behave as we change their constants in the set of rationals. Now lets look at what happens when the coefficient of x-square is negative and the other two constants are 0; that is when a=-2, b=0, and c=0


Now the parabola changed its shape and opened downwards to infinity, but centered at the origin as seen on graph number 3 above. We can then conclude that no matter what value of the rational we put at the coefficient of x-squared whether negative or positive, if the values of b and c equal 0, the parabolas will open upwards if a is positive, and opens downwards if the value of a is negative. Lets graph different functions together to illustrate the idea for a closure.
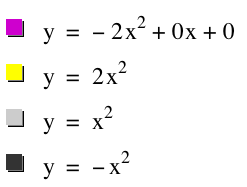

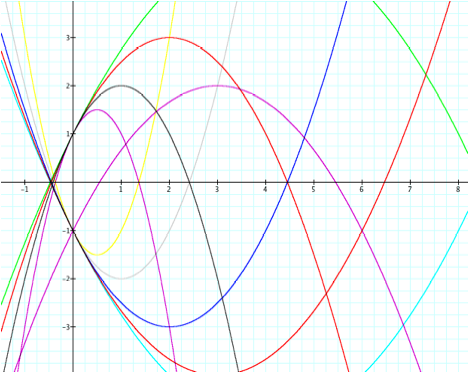
Graph 5
As seen on the graph we can see the parabolas when values of a is either positive or negative. A little observation we can make is by looking at the graphs the way they expand along the x- axis. When a>1 the parabolas opens upwards and compress inward horizontally. If a>0 but a<1 the parabola stretch out depending on how smaller the fraction is. For the negative values where 0>a<-1 the parabolas opens downward and they stretch horizontally along the lower part of the x-axis.
Now we need to observe what will happen to the parabolas if we change the values of b, and c.


Graph 6
After changing the values of b and c we can see how the parabolas behaved. The one thing we noticed is the fact that the y-intercept corresponds to the value of c If the value of c was positive its y-intercept was positive too, and vice versa. If the value of b>0 the vertex shifted to the right and below the x-axis i.e shifting down along the negative y-axis. It seems that the vertex will always be at the value when x=-b/2a. Let’s draw two parabolas and see whether the claim holds and conclude it.

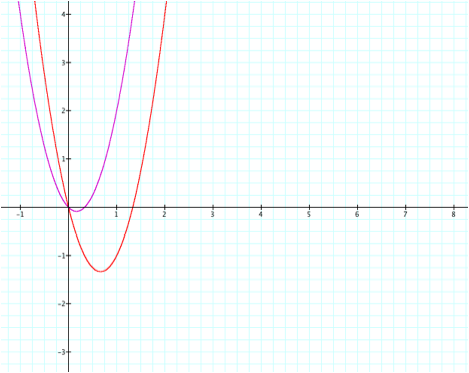
Graph 7
Using the two above graphs a=3 and b=-1 the vertex is at x=1/6, and when a=3 and b=-4 the vertex is at x=2/3. Using the formula we gave above we find that the value of x=-(-1)/6=1/6, for the first equation while for the second equation x=-(-4)/6=4/6=2/3 as seen on the graphs. It seems the formula was correctly guessed.
As a way to summarize the whole investigation we need to do one more graph to recall all of the findings and record a nutshell conclusion, that is what happens from the beginning of the exploration. Let’s pick a very simple expression to make our lives simple.


Graph 8
This is a graph of a parabola for the above equation. The value of a=-1, b=4 and c=-3. Since the value of a is negative the parabola opens downward and it extends horizontally along the x-axis that is the value of a is greater than -1 but less than 0 The vertex will be located at point -4(2.(-1/3)=6; so the vertex is (6.9). The y-intercept will be at point (0,-3) as we earlier found and discover during the exploration that it will always be the constant term, the value of c. We can also add that if the value of a was positive our parabola would have opened upwards as we saw in the exploration. If a is negative we have this case and it is so vivid. When the value of |a|<1 the parabola will stretch horizontally, and when |a|>1 the parabola compresses horizontally also. The coefficient of x, that is the value of b helps us to find the vertex point, and we discovered that it can be calculated by the little formula x=-b/2a, and the constant term gives us the y-intercept point.